
How to Calculate the Power Generation of a Solar Panel? Step-by-Step Guide
Trying to figure out how much electricity your solar panels can actually produce? That’s pretty important if you want to plan your energy needs or get a sense of your savings. Here’s the simple math: multiply your average sunshine hours by your panel’s wattage, then multiply that by 0.75 to account for real-world losses.
For instance, let’s say you’ve got a 200-watt panel and your spot gets 5 hours of good sun each day. The math looks like this: 5 hours × 200 watts × 0.75 = 750 watt-hours per day. Not rocket science, right?
This formula gives you a starting point. But, honestly, a bunch of factors will nudge your actual output up or down.
Your location, which way your panels face, and the weather all matter more than you’d think. If you want a solid estimate, you’ll need to factor those in.
Key Takeaways
- Solar panel power generation? Just sunshine hours × panel wattage × 0.75 for daily output.
- Location, panel direction, efficiency, and weather all have a big impact on what you actually get out of your system.
- Knowing how to do these calculations helps you size your solar panel system and predict your savings.
Core Principles of Solar Panel Power Generation
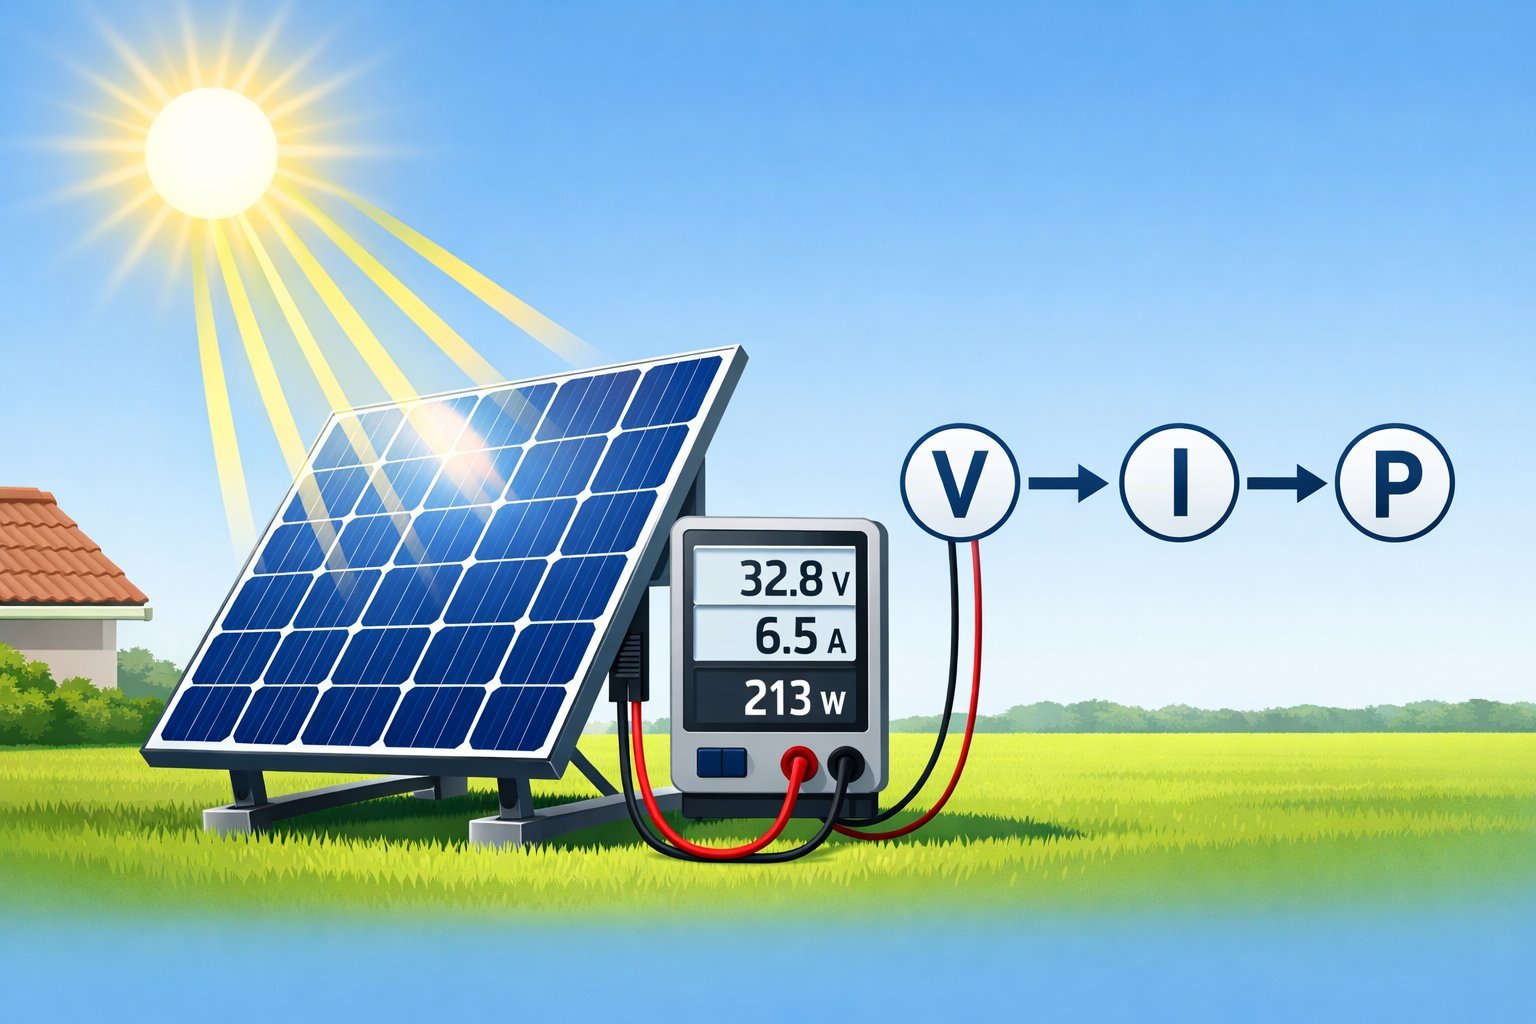
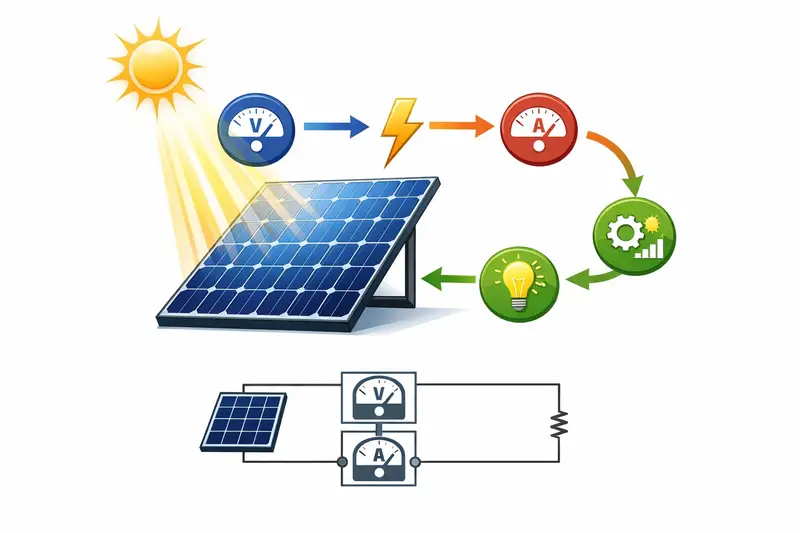
Solar panels turn sunlight into electricity using photovoltaic cells. The power you get out depends on three main things: how intense the sunlight is, the conditions used to rate the panels, and how efficiently your panels convert light into electricity.
What Is Solar Panel Power Generation?
Solar panel power generation is just converting sunlight into electrical energy, measured in watts or kilowatt-hours. When sunlight hits your solar panel’s photovoltaic cells, it creates a current you can use to run your home or business.
Your panel’s rated wattage tells you what it could deliver in perfect conditions. A 200-watt panel gives you 200 watts when everything lines up perfectly. But, let’s be honest, real life rarely matches the lab.
Actual output jumps around during the day, depending on the weather, the season, and where you put your panels. You’ll see the most electricity around midday, when the sun’s blazing, and a lot less early or late in the day.
Understanding Solar Irradiance and Peak Sun Hours
Solar irradiance basically measures how much solar energy hits a certain spot—usually in watts per square meter. Peak sun hours? That’s the time when solar irradiance is at 1000 watts per square meter, which is the standard labs use to test panels.
Your location decides how many peak sun hours you get. If you’re closer to the equator, you’ll see more peak sun hours than someone way up north. If your area gets 5 peak sun hours, your panels get the equivalent of 5 hours at full intensity.
Don’t confuse peak sun hours with total daylight. You might have 12 hours of sunlight, but only 5 of those really count for peak production.
Role of Standard Test Conditions and Panel Efficiency
Standard Test Conditions (STC) just set a baseline for comparing panels. Labs test panels at 77°F (25°C) with 1000 watts of sunlight per square meter. That way, you know what your panel could do in theory.
Panel efficiency tells you what percent of sunlight turns into electricity. If you’ve got a 15% efficient panel, it converts 15% of the sunlight it gets into usable power. Higher efficiency means more electricity from the same amount of sun.
Out in the real world, your panels almost never hit STC. Heat, shade, dust, and the panel angle all chip away at efficiency. That’s why most folks use a 75% factor when they crunch the numbers.
Factors That Affect Solar Power Output
Solar panel output really depends on a bunch of technical and environmental stuff. You can lose 20-30% of your panel’s rated power just from these factors alone.
If you want to get a realistic idea of what your panels will produce, you’ll want to look at solar irradiance data, roof details, temperature effects, and system losses.
Geographic Location and Solar Irradiance Data
Your location is huge—it decides how much sunlight your panels get over the year. Solar irradiance data measures the energy hitting a spot, usually in kilowatt-hours per square meter per day (kWh/m²/day).
The National Renewable Energy Laboratory (NREL) has solar maps that show average irradiance by region. Arizona often gets 5-7 peak sun hours a day, while places like Maine might only get 3-4. You can look up your specific spot in the NREL database if you’re curious.
Remember, peak sun hours mean the time when sunlight hits 1000 watts per square meter. That’s different from total daylight, since the sun is weaker in the morning and evening. Five peak sun hours could happen during a 12-hour day if most of the time the sun isn’t at its strongest.
Impact of Roof Orientation and Tilt Angle
Roof orientation makes a big difference in how much energy you get. In the Northern Hemisphere, south-facing roofs usually win—they catch the most direct sun.
Optimal roof orientation by direction:
- South-facing: 100% optimal output
- Southwest/Southeast: 90-95% of optimal output
- East/West-facing: 75-85% of optimal output
- North-facing: 50-60% of optimal output
The tilt angle matters too. Your latitude usually sets the best tilt. In the U.S., 30-40 degrees works for most places. Flat roofs need special mounts to get the right angle, while steep roofs sometimes need tweaks to hit the sweet spot.
Seasons change the sun’s angle, so a fixed tilt is always a compromise. Some folks use adjustable mounts or tracking systems to follow the sun, but those can get pricey and complicated.
Temperature Coefficient and Environmental Effects
Solar panels get less efficient as they heat up. The temperature coefficient tells you how much power output drops for every degree Celsius above 25°C (77°F).
Most panels have a coefficient between -0.3% and -0.5% per degree Celsius. So, if your panel’s at 45°C and has a -0.4% coefficient, you lose 8% of its rated power compared to lab conditions. On hot days, panels often hit 50-65°C, which can drop output by 10-16%.
Environmental factors that mess with output:
- Shade: Even a little shade on one panel can slash system output by 20-40%.
- Dust and dirt: Buildup blocks sunlight and can cut output by 5-10%.
- Snow cover: No energy production until it melts or slides off.
- Humidity: High moisture can lower the amount of sunlight reaching your panels.
If you can keep air moving around your panels, they’ll stay cooler. Ground-mounted systems usually run cooler than roof-mounted ones, just because air can flow underneath.
System Losses: Inverter, Cable, and Performance Ratio
As electricity travels from your panels to your home, you lose some along the way. These losses mean you’ll never get 100% of what your panels generate.
Modern inverters are pretty efficient—usually 95-98%. They convert DC electricity from your panels into AC for your house. But, you still lose 2-5% as heat. If your inverter isn’t running at its sweet spot, you could lose a bit more.
Cable losses happen as electricity moves through wires. Longer runs and thin wires mean more resistance. Most setups lose 1-3% here, but bad wiring can push that higher.
The performance ratio lumps all these losses together. If your system has a performance ratio of 0.75, you’re getting 75% of the theoretical maximum. Decent systems usually hit between 0.75 and 0.85.
Typical system losses breakdown:
| Loss Type | Percentage Range |
|---|---|
| Inverter losses | 2-5% |
| Cable losses | 1-3% |
| Mismatch losses | 1-2% |
| Soiling losses | 2-5% |
| Temperature losses | 5-15% |
To estimate your real daily output, you just multiply your panel’s rated power by peak sun hours and the performance ratio.
Step-by-Step Calculation of Power Generation
You only need three main inputs to calculate solar panel output: your panel’s wattage rating, your area’s average peak sun hours, and the expected system losses. Most systems lose about 25% of possible power to things like heat, shade, and inverter inefficiency.
Identifying Key Input Values: Wattage, Peak Sun Hours, and Losses
Your panel’s wattage rating shows its max output under perfect conditions. You’ll usually find this on the panel’s label or spec sheet. A 300-watt panel will give you 300 watts if everything’s ideal.
Peak sun hours are the hours when sunlight reaches 1,000 watts per square meter. This isn’t the same as total daylight—sometimes you’ll have 12 hours of daylight, but only 5 of those are peak.
Don’t forget to factor in real-world losses. These usually add up to about 25% and include:
- Temperature effects – panels lose juice when they get hot
- Shading – even a little shade can hurt output
- Inverter losses – converting DC to AC wastes a bit
- Dirt and debris – dust buildup blocks sunlight
- Wiring losses – resistance eats up some power
Most people just use 75% (or 0.75) as a performance ratio to keep things simple.
Manual Calculation Formula Explained
The basic formula for solar panel output is: Peak Sun Hours × Panel Wattage × 0.75 = Daily kWh.
This gives you daily energy production in kilowatt-hours (kWh). The 0.75 factor covers system losses, though some people use 0.80 for newer or really well-kept systems.
To get annual energy production, just multiply your daily output by 365. Want to account for seasons? Use different peak sun hour values for summer and winter.
The panel’s efficiency is already baked into its wattage rating. So, a 300-watt panel already reflects its efficiency level—you don’t need to do extra math there.
Using Online Tools and PVWatts Calculator
The PVWatts Calculator from the U.S. Department of Energy gives pretty accurate estimates based on your location. You just punch in your address, system size, and panel tilt angle.
The tool uses loads of weather data to predict how your solar panels will perform. PVWatts automatically factors in local weather, temperature, and seasons.
It spits out monthly and annual production estimates. The calculator also includes default system loss values typical for most installs.
Other online calculators work in much the same way, though they might use different data or assumptions. Most of them want your system size in watts, zip code, and the installation angle.
Worked Example for Daily and Annual Output
Let’s run through an example with a 200-watt panel in a spot that gets 5 average peak sun hours:
Daily calculation: 5 hours × 200 watts × 0.75 = 750 watt-hours, or 0.75 kWh per day.
Annual calculation: 0.75 kWh × 365 days = 273.75 kWh per year.
For a full home system with 20 panels (4,000 watts total):
Daily output: 5 hours × 4,000 watts × 0.75 = 15,000 watt-hours, or 15 kWh per day.
Annual output: 15 kWh × 365 days = 5,475 kWh per year.
Your actual numbers will bounce around by month. Summer’s longer days crank out more power, while winter’s shorter days mean less. And let’s be honest, location is huge—Arizona gets way more peak sun hours than Washington state.
Advanced Considerations and Optimization

There’s more to solar than just the basic math. How you store, use, and squeeze the most out of your solar energy depends on a few key things.
If you’re thinking about off-grid storage, want to geek out with monitoring tools, or aren’t sure when to call in a pro, a little know-how helps you get the most from your investment.
Off-Grid Systems and Net Metering
Off-grid setups need battery storage for those times the sun’s hiding. To figure out your minimum battery capacity, calculate your daily energy use in kilowatt-hours and multiply by 3-5 days. That buffer covers cloudy stretches and seasonal dips in solar production.
Net metering works differently with grid-connected systems. Your utility credits you for extra electricity your panels send to the grid when it’s sunny.
You can use those credits at night or when your system isn’t keeping up, like in winter. How much you actually save depends on your local net metering rules.
Some utilities offer one-to-one credits—every kilowatt-hour you export means one you can use later. Others pay you less for what you send back, or limit your annual credits. It’s worth checking the fine print.
Monitoring and Improving System Efficiency
Solar monitoring systems let you track your real-time and historical production through apps or dashboards. You’ll see exactly how many kilowatt-hours you’re making each day.
These tools can alert you if your output drops—maybe your panels need a cleaning or there’s an equipment issue. In dusty spots, cleaning can boost output by 5-15%.
It’s a good idea to inspect your panels every 3-6 months, and clean them if you spot dirt, leaves, or bird droppings. Micro-inverters and power optimizers help you claw back energy lost to partial shading.
Traditional string inverters drag down output for all panels if just one gets shaded. With micro-inverters or optimizers, each panel runs on its own, which is a lifesaver if trees or buildings cast shadows during the day.
When to Consult Solar Installers and Professionals
Pros have specialized tools to measure roof angles, do shading analysis, and model your system’s performance. Their assessments are usually much more accurate than basic calculations, especially if your roof is weirdly shaped or your weather is all over the place.
If your property has oddball conditions—multiple roof angles, lots of trees, or structural quirks—it’s smart to get an expert involved. They’ll make sure your system is safe and efficient.
Licensed electricians need to handle grid connections and electrical panel upgrades. Permits and inspections are required in most places, and pro installers usually take care of all that paperwork for you.
Frequently Asked Questions
Solar panel power calculations aren’t just about one number. You need to think about efficiency, location, orientation, and testing standards—they all play a part in figuring out your solar output.
What are the factors that affect the energy output of a solar panel?
A few main things determine how much electricity your solar panels generate. Panel efficiency tells you how well your system turns sunlight into power.
Nearby buildings or trees can cast shade and cut your output. Weather and location make a big difference too—sunny places simply produce more electricity.
Dirt, dust, and debris block sunlight from the cells. Cleaning your panels regularly helps keep them working their best.
How do you determine the efficiency of a solar panel for electricity generation?
Panel efficiency is just the percentage of sunlight your panel converts into electricity. If your panel is rated at 15% efficiency, it turns 15% of the sunlight it gets into usable power.
You’ll find the efficiency rating in the specs from the manufacturer. It’s a handy number for comparing panels and figuring out how much roof space you’ll need.
Higher efficiency panels cost more, but they save space. If your roof area is tight, they’re often worth it.
What is the process for measuring a solar panel’s performance under standard test conditions?
Standard Test Conditions (STC) give everyone a level playing field for comparing panels. Labs test them at 77°F with 1000 watts of sunlight per square meter.
Manufacturers use these controlled conditions to rate their panels. So, a 250-watt panel will produce exactly 250 watts under STC.
But your real-world output will be different. Temperature, weather, and how you install the panels all affect performance where you live.
Can you explain the role of peak sun hours in solar power calculations?
Peak sun hours measure when sunlight intensity hits 1000 watts per square meter at your place. It’s not just total daylight hours—early and late sun is weaker.
Your average peak sun hours depend on where you live. Southern spots usually get more than northern ones.
Peak sun hours are essential for calculating daily energy production. If your area gets 5 peak sun hours, that’s like having 5 hours of max sunlight, even if the sun’s up for 12 hours total.
What is the formula to compute the expected electricity production from a solar panel system?
The basic formula is average peak sun hours × panel wattage × 0.75. That gives you daily watt-hours of production, with the 0.75 covering losses from heat, dirt, and system inefficiencies.
Say you have a 200-watt panel and 5 peak sun hours: 5 × 200 × 0.75 = 750 watt-hours per day. Multiply by 30 for a monthly estimate, or 365 for the year.
Some calculators use different efficiency factors, anywhere from 0.70 to 0.80, depending on how good your system is. Your real performance will depend on your equipment and how well it’s installed.
How does panel orientation and tilt impact solar power generation?
The direction your panels face really shapes how much sunlight they soak up. In the northern hemisphere, when panels face south, they tend to catch the most direct sunlight during the day.
If you point your panels west, they’ll grab more of that late-day sun. That can matter a lot if your electricity use spikes in the evening.
Panels facing east? They’ll wake up early and deliver more power in the morning hours.
Tilt angle plays a big role, too. When you set the tilt to match your latitude, you’ll usually get the most power over a year.
Some folks adjust their panels seasonally for a little extra output during certain months. Still, for most people, a fixed setup gets the job done just fine.


