Solar Panel Degradation Rate 2026: What B2B Buyers Need to Know
Solar panel degradation is the gradual decline in power output over a system’s lifetime. Understanding the real rates matters for your investment returns.
Modern solar panels degrade at a median rate of 0.5% per year according to NREL’s analysis of over 54,000 systems. Newer N-type technology achieves even lower rates of 0.3-0.5% annually.
This means a panel rated at 400W today will produce roughly 347W after 25 years with standard degradation. With premium N-type technology, you’re looking at closer to 365W after the same period.
The difference between 0.4% and 0.7% annual degradation might look small at first glance. But over decades, the numbers add up—especially for a 100 MW solar farm, where that seemingly tiny variation can mean millions in revenue.
Your choice of panel technology, manufacturer quality, and climate conditions all play big roles in actual degradation rates. Sometimes it’s easy to overlook, but these details really matter.
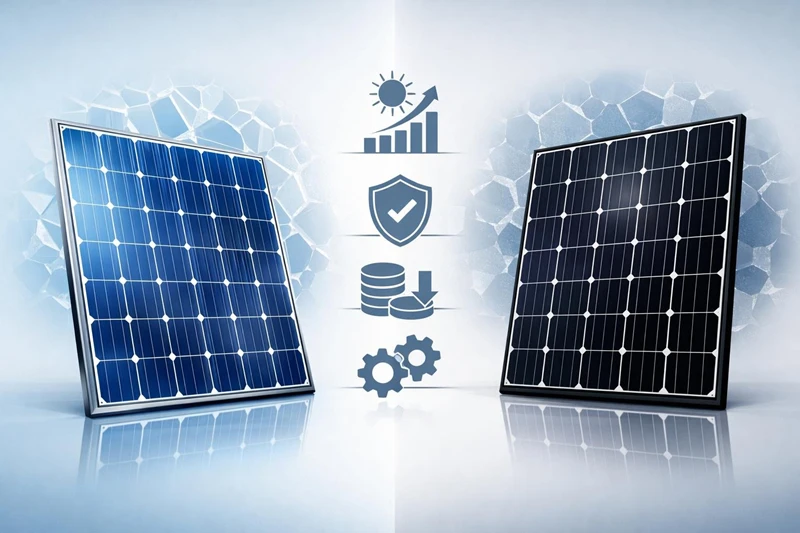
The 2026 market leans hard toward N-type silicon panels, which eliminate the boron-oxygen degradation that plagued older P-type technology. These newer panels cost just 1-2% more upfront but deliver 5-7% higher lifetime energy yields.
Knowing these degradation rates helps you build financial models that actually match reality. It also guides you to the right technology for your project’s unique needs.
Key Takeaways
- Modern solar panels degrade at 0.5% per year on average, with premium N-type technology achieving 0.3-0.5% rates that preserve more output over 25-30 years.
- The difference between standard and low degradation rates can mean millions in revenue for utility-scale projects and thousands for commercial installs.
- Climate, technology type, and manufacturer quality create 2-3x variation in degradation rates, directly impacting your long-term returns.
Key 2026 Solar Panel Degradation Rates and Trends
Modern solar panels generally degrade at median rates of 0.5-0.7% annually. Premium n-type technology can push that figure as low as 0.35% per year.
Technology choices and climate conditions create huge swings in long-term performance for commercial buyers. It’s not just about picking a panel off the shelf—context matters.
Current Annual Degradation Rate Benchmarks
The photovoltaic degradation rates you should expect in 2026 depend primarily on cell technology. NREL’s analysis of over 54,000 systems puts the median degradation rate at 0.75% per year across all panel types globally.
Modern panels made after 2015 do better, averaging 0.50% annually. Premium n-type panels hit the lowest rates in the industry.
N-type TOPCon technology sits at 0.35% to 0.50% per year. Advanced heterojunction (HJT) panels reach 0.25% to 0.40%. Standard p-type PERC panels degrade at 0.55% to 0.75% annually.
| Technology Type | Annual Degradation Rate | 25-Year Retention |
|---|---|---|
| P-type PERC | 0.55-0.75% | 84.8-86.5% |
| N-type TOPCon | 0.35-0.50% | 89.4-91.2% |
| N-type HJT | 0.25-0.40% | 90.5-92.8% |
These numbers reflect stabilized performance after the initial light-induced degradation. Your actual rate will fall somewhere in these ranges, depending on manufacturer quality and how your panels get installed.
Improvements Seen in Modern Panels
Solar panel degradation rates have dropped by 40% over the past decade. Panels built before 2010 lost 1.10% per year, but current modules now hit 0.50% annually.
Better encapsulants, improved cell metallization, and advanced anti-reflective coatings all contributed to this progress. N-type technology also eliminates boron-oxygen defects that hit older p-type panels hard.
SunPower Maxeon and REC Alpha modules use n-type cells that avoid the 2-3% first-year light-induced degradation common in p-type PERC. By Q4 2025, n-type panels made up about 60% of global production capacity.
Modern inverters now include PID recovery modes that reverse potential-induced degradation overnight. This feature protects your panels from voltage-induced losses that used to cause 20-30% power drops within five years.
Premium manufacturers use POE encapsulants instead of EVA to prevent moisture ingress and ion migration. It’s a subtle change, but it makes a difference over the long haul.
Variations by Technology Type
N-type panels outperform p-type technology across all degradation metrics. P-type PERC panels use boron-doped silicon that creates defect complexes when exposed to light, causing 2-3% first-year losses.
N-type TOPCon uses phosphorus doping, which eliminates this problem. The annual degradation rate gap between technologies compounds significantly over a project’s life.
A p-type panel degrading at 0.70% annually keeps 84.0% capacity at year 25. An n-type panel at 0.35% per year keeps 91.0% capacity. That 7 percentage point difference? It translates to millions in extra revenue for big projects.
Technology Performance Comparison:
- P-type PERC: Higher first-year losses, moderate ongoing degradation, needs PID mitigation
- N-type TOPCon: Minimal first-year losses, 0.35% per year degradation, natural PID resistance
- N-type HJT: Lowest degradation at 0.25-0.40% annually, best temperature coefficients, highest bifaciality
SunPower and REC lead the premium segment, with proven degradation rates below 0.40% per year in real-world conditions.
Regional and Climate Impacts on Degradation
Your location creates 2-3x variation in photovoltaic degradation rates, no matter which technology you pick. Hot, dry desert climates like Arizona, Nevada, and the Middle East show rates of 0.9-1.2% per year.
Moderate temperate regions like Germany and the Pacific Northwest get 0.4-0.6% annually. Extreme thermal cycling accelerates panel degradation with solder fatigue and cell cracking.
Desert installations see daily temperature swings of 50-60°C, creating over 10,000 expansion-contraction cycles during a 25-year lifespan. Humidity in tropical coastal regions speeds up corrosion and ion migration, which causes PID.
| Climate Zone | Annual Degradation Rate | Primary Stressors |
|---|---|---|
| Hot/Dry Desert | 0.9-1.2% | Thermal cycling, UV intensity |
| Hot/Humid Tropical | 0.8-1.0% | Humidity, corrosion, PID |
| Moderate Temperate | 0.4-0.6% | Minimal environmental stress |
| Cold/Snowy | 0.5-0.7% | Snow load, freeze-thaw cycles |
Factor in climate-specific degradation when modeling long-term energy production. A panel with 0.35% per year degradation in Germany might see 0.55% in Arizona heat.
Causes and Mechanisms of Solar Panel Degradation
Solar panels lose power output through four main degradation mechanisms: light-induced defects in silicon cells, voltage-driven ion migration, physical stress from temperature cycling, and environmental breakdown of protective materials.
Modern panels degrade at 0.5-0.7% annually, but understanding these specific causes helps you pick technologies that minimize long-term losses. It’s not just specs—it’s about the real-world stuff that chips away at performance.
Light-Induced Degradation (LID)
LID happens during the first 24-1000 hours of sunlight exposure. Photons create defects in your silicon cells, and in P-type boron-doped silicon, light forms boron-oxygen complexes that trap electrons and drop efficiency by 1-3% in the first year.
This one-time loss is permanent and hits fastest in standard P-type PERC panels. You can dodge most LID by choosing gallium-doped silicon or N-type cells, which don’t use boron and typically show only 0.5-1.0% first-year loss instead of 2-3%.
LETID (Light and Elevated Temperature Induced Degradation) is a separate issue for some P-type PERC panels. This defect causes another 2-7% loss over the first three years if panels run hot. Severity varies a lot by manufacturer, so always review third-party test data before you buy.
Potential-Induced Degradation (PID)
PID strikes when high system voltage creates current leakage between your cells and the grounded aluminum frame. This voltage difference makes sodium ions migrate from the glass into the silicon, creating shunt paths that can cut power output by 20-30% within 2-5 years.
Your risk jumps with system voltages above 1000V DC, especially in hot and humid climates where ion mobility speeds up. Panels at negative potential relative to ground face the biggest danger.
You can prevent PID in a few ways:
- Anti-PID cell coatings on P-type panels
- N-type technology with natural resistance
- POE encapsulants instead of EVA
- Inverter PID recovery modes that reverse polarity at night
- Virtual grounding systems that eliminate negative potential
Modern inverters often include nighttime voltage reversal features that actively reverse existing PID damage. This issue’s less critical than it was five years ago, but it’s still worth keeping an eye on.
Thermal Cycling and Mechanical Stress
Your panels expand and contract every day as cell temperatures swing from 60-85°C during operation to ambient at night. After 10,000+ cycles, this repetitive stress creates microcracks in silicon wafers and fatigues solder connections between cells.
These microcracks boost series resistance and create isolated cell sections that can’t contribute to power output. Damage piles up faster in desert climates, where daily temperature swings hit 50-60°C, compared to 20-30°C in moderate regions.
Mechanical stress comes from wind loading, snow build-up, and even installation handling. Panels with thinner wafers (below 160 microns) show higher microcrack rates. You’ll see this reflected in higher degradation rates—0.9-1.2% annually in hot-dry climates, versus 0.4-0.6% in temperate zones.
Material Aging and Environmental Factors
Your panel’s encapsulant and backsheet materials break down over decades of UV exposure, moisture, and heat. Standard EVA encapsulant yellows and gets brittle, reducing light transmission by 2-4% and letting in moisture that corrodes cell metallization.
Moisture penetration causes several failure modes. Water vapor slips through backsheet defects or edge seal failures, corroding the thin silver gridlines and creating high-resistance hotspots.
These hotspots ramp up local degradation and can trigger bypass diodes. UV radiation also damages your anti-reflective coatings and slowly breaks down the encapsulant polymer chains.
This process speeds up at high altitude, where UV intensity is 15-20% higher than at sea level. Modern panels use improved materials to slow these problems:
| Material | Legacy Option | Modern Alternative | Benefit |
|---|---|---|---|
| Encapsulant | EVA | POE | 50% less yellowing, better moisture barrier |
| Backsheet | Standard polyester | Glass-glass or fluoropolymer | Eliminates moisture ingress path |
| Edge seal | Butyl tape | Dual-seal systems | Reduces moisture penetration by 60% |
These material upgrades have made a real dent in degradation rates for panels made after 2015, especially compared to older systems.
Performance Warranties, Manufacturer Reliability, and Buyer Protections
Performance warranties guarantee minimum energy output over time. Product warranties cover hardware failures and defects.
In 2026, top manufacturers offer 25-40 year coverage with degradation rates as low as 0.25% per year. Of course, the warranty only matters if the manufacturer can actually honor claims decades down the road.
Performance vs. Product Warranties
Your solar panel warranties come in two flavors—one for defects and one for performance. A product warranty covers manufacturing defects, cracked cells, junction box failures, and frame corrosion.
These usually last 12 to 40 years, depending on the brand. A performance warranty (sometimes called a performance guarantee) protects you from excessive degradation and guarantees your panels will keep a minimum percentage of their rated output for a set period.
Most manufacturers now offer 25-30 year performance warranties guaranteeing 80-92% of original output at the end of the term. These two warranties work independently.
Your panels might meet the performance guarantee but still fail due to hardware issues that the product warranty covers. Both are important, especially if you’re planning for a system to last 25 years or more.
Key Metrics in 2026 Warranties
The annual degradation rate sets the value of your performance warranty. In 2026, premium manufacturers guarantee 0.25-0.40% degradation per year, while standard panels offer 0.50-0.55%.
If you get a 0.25% rate, that means 90% output after 40 years. At 0.55%, you’re looking at 86.25%.
Linear performance warranties have replaced the old tiered structure. Instead of “90% at year 10, 80% at year 25,” you get a steady, predictable annual decline.
This makes energy modeling a little less of a guessing game. Panel-level monitoring has become pretty much mandatory for warranty enforcement—manufacturers often want to see your monitoring data before they’ll honor a degradation claim.
IEC 61215 and TUV certifications show PV module reliability through standardized testing. These third-party tests back up manufacturer claims about durability and performance, but they don’t actually guarantee the warranty will be honored.
Panel Manufacturer Quality Differences
Your manufacturer’s financial health matters more than the length of the warranty. A 40-year warranty from a shaky company isn’t worth as much as a 25-year warranty from a bankable brand.
Check Bloomberg Tier 1 rankings and financial reports before you buy. The biggest names—JinkoSolar, LONGi, Trina Solar—have the strongest balance sheets and are more likely to pay out on claims.
Smaller premium brands like Maxeon offer great warranties but come with more financial risk. Where your panels are made also affects warranty service—domestic manufacturers usually handle claims faster than overseas companies.
Some buyers actually prefer shorter warranties from local manufacturers just for the easier claims process. Warranty transferability is another thing to watch, especially if you might sell the project. Most manufacturers allow one transfer, but some limit transfers or charge extra fees, so always check the fine print.
Financial and Operational Impact for B2B Buyers

Solar panel degradation hits your project’s bottom line by cutting energy production, lowering asset values, and shifting maintenance needs. Knowing how this plays out can help you make smarter buying decisions and set realistic expectations for those 25-30 year investments.
Effect on Asset Value and ROI
Your solar asset’s market value depends a lot on its actual degradation rate. A commercial project with 0.4% annual degradation will fetch 15-20% more than an identical system degrading at 0.8%.
This difference is huge when you’re refinancing, selling a portfolio, or doing a tax equity deal. Asset valuations usually rely on real degradation data from the first 3-5 years to estimate future output.
If your panels degrade faster than the 0.5% you modeled, you’ll probably need to write down the asset’s value. For a 100 MW project, going from 0.5% to 0.9% degradation can wipe out $4-6 million in net present value at a 6% discount rate.
Warranty coverage gives you a safety net, but it rarely matches what happens in the field. Most manufacturers guarantee 84-88% output at 25 years, but N-type panels often keep over 90% of their original output.
This extra performance isn’t covered by warranty but does boost your ROI by 8-12% over the system’s life.
Degradation’s Impact on Levelized Cost of Energy (LCOE)
Your LCOE calculation is super sensitive to degradation assumptions. For every 0.1% drop in annual degradation, your LCOE falls by about $0.40-0.60 per MWh over 25 years.
| Degradation Rate | 25-Year LCOE (¢/kWh) | Difference from Baseline |
|---|---|---|
| 0.7% (P-type baseline) | 4.20-4.35 | Baseline |
| 0.5% (modern average) | 3.85-4.00 | -8.3% |
| 0.4% (N-type TOPCon) | 3.65-3.80 | -13.1% |
| 0.3% (N-type HJT) | 3.50-3.65 | -16.7% |
If you’re running a 10 kW residential system and paying $0.12/kWh, the difference between 0.7% and 0.4% degradation adds up to $2,800-3,400 in lifetime savings. Commercial buyers see much bigger impacts on power purchase agreements and long-term budgets.
Maintaining Performance After Year 25
Your solar panels don’t just quit at year 25—they keep going, often with degradation rates that stabilize. Systems with 0.4% annual degradation reach year 25 at 90% capacity and can keep producing 80-85% output through year 35-40.
This longer life can mean extra revenue you didn’t count on. Most financial models assume decommissioning at year 25-30, but in reality, solar panels often last 35 years or more.
Modern N-type panels with low degradation rates make a strong case for planning on 30-35 year operating periods. That can add $8-15 million in NPV for a 100 MW project.
Solar maintenance costs usually stay flat through year 30, averaging $15-20/kW annually for inverters, cleaning, and monitoring. Still, your degradation rate decides whether it makes sense to keep the system running after the warranty ends.
Systems degrading faster than 0.6% per year often hit economic retirement by year 28-30. But if you’re at 0.4% or lower, it’s often worth running them through year 35 or beyond.
Frequently Asked Questions
Modern solar panels degrade at a median rate of 0.5% per year. N-type technology can get even lower, sometimes down to 0.3-0.5%.
Knowing how degradation affects warranties, ROI, and mitigation strategies helps you make smarter procurement choices.
What is the average degradation rate for solar panels as of 2026?
The median degradation rate for modern panels installed after 2015 is 0.5% per year. That’s a big step up from the 1.1% rate seen in panels from before 2010.
Your actual rate depends a lot on the technology. P-type PERC panels degrade at 0.55-0.75% annually, N-type TOPCon panels hit 0.35-0.50%, and N-type HJT tech can get as low as 0.25-0.40% per year.
Climate matters too. Hot, dry deserts push degradation up to 0.9-1.2% annually, while temperate climates usually see 0.4-0.6%.
How does degradation rate impact the long-term return on investment for commercial solar installations?
Degradation rate directly affects your energy production and revenue over 25-30 years. For example, a 100 MW solar farm with 0.7% annual degradation produces 151,200 MWh in year 25, but with 0.4% degradation, you get 163,800 MWh.
The revenue gap gets big over time. At a $50/MWh power purchase agreement, that lower degradation rate brings in an extra $6.8 million in net present value over 25 years. That easily justifies the $0.01-0.02/W premium for N-type technology.
The gap between 0.4% and 0.7% degradation might sound small at first. But over 25 years, 0.4% degradation leaves you with 90.6% capacity retention compared to 84.0% for 0.7%. That 6.6 percentage point difference is worth millions for utility-scale projects.
What are the primary factors contributing to solar panel degradation in 2026?
Light-induced degradation (LID) knocks off about 1-3% of a panel’s output during the first 24 to 1000 hours of sun exposure. P-type silicon panels, which use boron doping, end up with boron-oxygen defects that cut efficiency.
N-type panels skip that problem entirely since they use phosphorus instead of boron. So, you avoid that particular headache with N-type tech.
Potential-induced degradation (PID) is another culprit. High system voltage can push leakage current between the cells and the grounded frame, and if you don’t have mitigation strategies, you might lose 20-30% of your panel’s power in just a few years.
N-type technology shrugs off PID much better than P-type panels. That’s a big plus if you ask me.
Then there’s thermal cycling. Daily temperature swings put panels through a lot—heating up to 60-85°C during the day and cooling off at night.
After 10,000 or more of these cycles, you’ll see things like solder fatigue, cell cracks, and even encapsulant delamination. It’s not exactly what you want from a long-term investment.
What advancements have been made to reduce solar panel degradation rates in recent years?
The shift to N-type silicon technology stands out lately. N-type TOPCon cells now make up over 60% of global production as of late 2025, which is wild when you think about it.
These panels degrade at just 0.35-0.50% per year, while P-type PERC panels lose 0.55-0.75%. That’s a pretty clear upgrade for anyone keeping score.
Modern inverters help too. They’ve got nighttime PID-recovery modes that actually reverse some voltage-induced losses by applying positive voltage to the modules when the sun’s down.
Virtual grounding systems float the array at mid-potential instead of negative ground, which lowers PID risk even more. It’s a clever workaround.
Encapsulants have gotten an upgrade as well. POE (polyolefin elastomer) replaces the old EVA materials and does a much better job blocking ion migration and keeping out moisture.
Manufacturers have also improved anti-reflective coatings and cell metallization, which all add up—degradation rates have improved by about 40% in the last ten years. That’s not nothing.
How can businesses mitigate the effects of solar panel degradation?
Choosing N-type technology is probably your best bet. Panels with this tech degrade 30-50% less than P-types, so over 25 years, you’ll see an energy yield boost of 5-7%—not bad at all.
The LCOE advantage for TOPCon is 3-5%, and for HJT, it’s 5-8%. That usually makes the slightly higher upfront cost worth it, at least in my book.
Double-check that your inverter has PID mitigation features. Nighttime voltage reversal and virtual grounding systems are worth looking for.
If you’re installing panels in coastal or tropical areas, you’ll want PID-resistant cells or anti-PID coatings on your P-type panels. Salt and humidity are relentless.
It helps to design for the climate, too. In hot, dry places, pick panels with lower temperature coefficients and make sure there’s enough airflow behind the modules.
Before you buy, go over PVEL PQP test results to find manufacturers with proven resistance to LETID (Light and Elevated Temperature Induced Degradation). It’s not exactly thrilling reading, but it pays off.
What warranty options are available to cover solar panel performance degradation?
Standard P-type PERC warranties guarantee 84.8% capacity retention at 25 years. They account for typical degradation rates of 0.55-0.75% per year, plus first-year LID losses of 2-3%.
Premium N-type manufacturers have started offering 30-year performance guarantees. N-type TOPCon warranties usually promise 88.0% retention at 30 years, while N-type HJT warranties push that to 90.0%.
These extended warranties show off the better degradation resistance of phosphorus-doped silicon. Your warranty coverage generally includes two parts: a product warranty for manufacturing defects (10-15 years) and a performance warranty for power output loss (25-30 years).
Check if the performance warranty uses a linear degradation curve or step-down thresholds. Linear warranties tend to give you better protection for the long haul.