
N-Type vs P-Type Solar Panels 2026: Full Comparison for B2B
The solar industry’s in the middle of a big shift in 2026. Manufacturing lines around the world are turning away from P-type PERC panels, which basically ran the show for decades, and picking up N-type technologies like TOPCon and HJT.
If you’re sourcing panels for commercial projects, utility-scale jobs, or just buying in bulk, you’ll want to get a grip on this transition. It’ll hit your project economics and long-term returns in ways that are hard to ignore.

N-type solar panels hit 23-26% efficiency compared to P-type’s 20-23%. They dodge first-day light-induced degradation losses, handle heat better thanks to improved temperature coefficients, and degrade at about half the annual rate over a 30-35 year lifespan.
These perks add up to noticeably higher energy production and a lower levelized cost of energy over your system’s life. N-type techs now make up more than 60% of global production capacity, and their prices are basically neck-and-neck with P-type.
So, it’s really not about if you should look at N-type anymore—now it’s about which architecture fits your project best.
This guide lays out the technical differences, performance numbers, cost breakdowns, and market dynamics you’ll want to know for smart sourcing in 2026. I’ll walk you through how the silicon chemistry actually affects output in the real world, which jobs make sense for TOPCon versus HJT, and what ditching P-type means for your supply chain and warranties.
Key Takeaways
- N-type panels offer 2-6% higher efficiency, zero light-induced degradation, and better heat performance than P-type tech.
- TOPCon leads with 60% market share due to lower manufacturing costs, while HJT goes to premium projects where every watt counts.
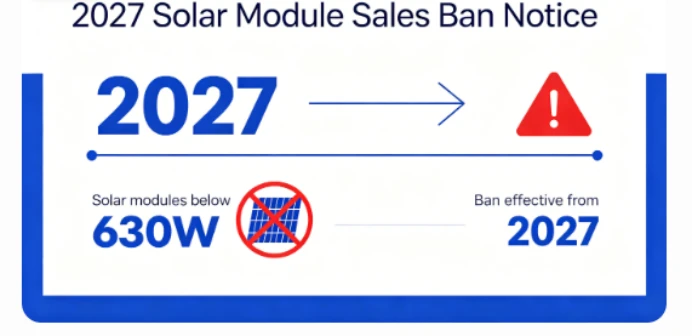
- P-type PERC production is shrinking fast as factories switch over to N-type, and by 2027, PERC lines will basically be history.
How N-Type and P-Type Solar Panels Work
Both N-type and P-type solar panels turn sunlight into electricity using the same basic process. The difference? It’s all about how their silicon is tweaked and which type of charge carrier gets the job done.
Understanding the Photovoltaic Effect
The photovoltaic effect is what lets solar panels make electricity. When sunlight hits a solar cell, photons transfer their energy to electrons in the silicon.
Those energized electrons break free from their atoms and start moving through the material. That movement creates the electrical current you can actually use.
The silicon in solar cells needs special treatment to make this happen efficiently. If you skip those modifications, the freed electrons just snap back to their atoms instead of flowing out as useful electricity.
Your panel needs both positive and negative regions to push electrons in one direction and keep the current steady. That’s where the N-type and P-type split really matters.
PN Junction Basics in Solar Cells
A PN junction forms when N-type silicon (negatively doped) meets P-type silicon (positively doped). N-type silicon has extra electrons, while P-type has “holes”—places where electrons are missing.
When they come together, they create an electric field at the boundary. This field acts like a one-way gate for electrons, pushing them toward the negative terminal, while the holes drift toward the positive terminal.
Minority carriers are a big deal for panel quality. In P-type cells, electrons are the minority carriers; in N-type, it’s holes. N-type panels usually perform better—electrons move faster through silicon than holes do, so you get higher efficiency and less power loss over time.
Structural and Material Differences
The main difference between N-type and P-type solar panels comes down to the doping elements and how the bulk region and emitter layer stack up. These structural tweaks have a direct effect on how long panels last and how well they perform.
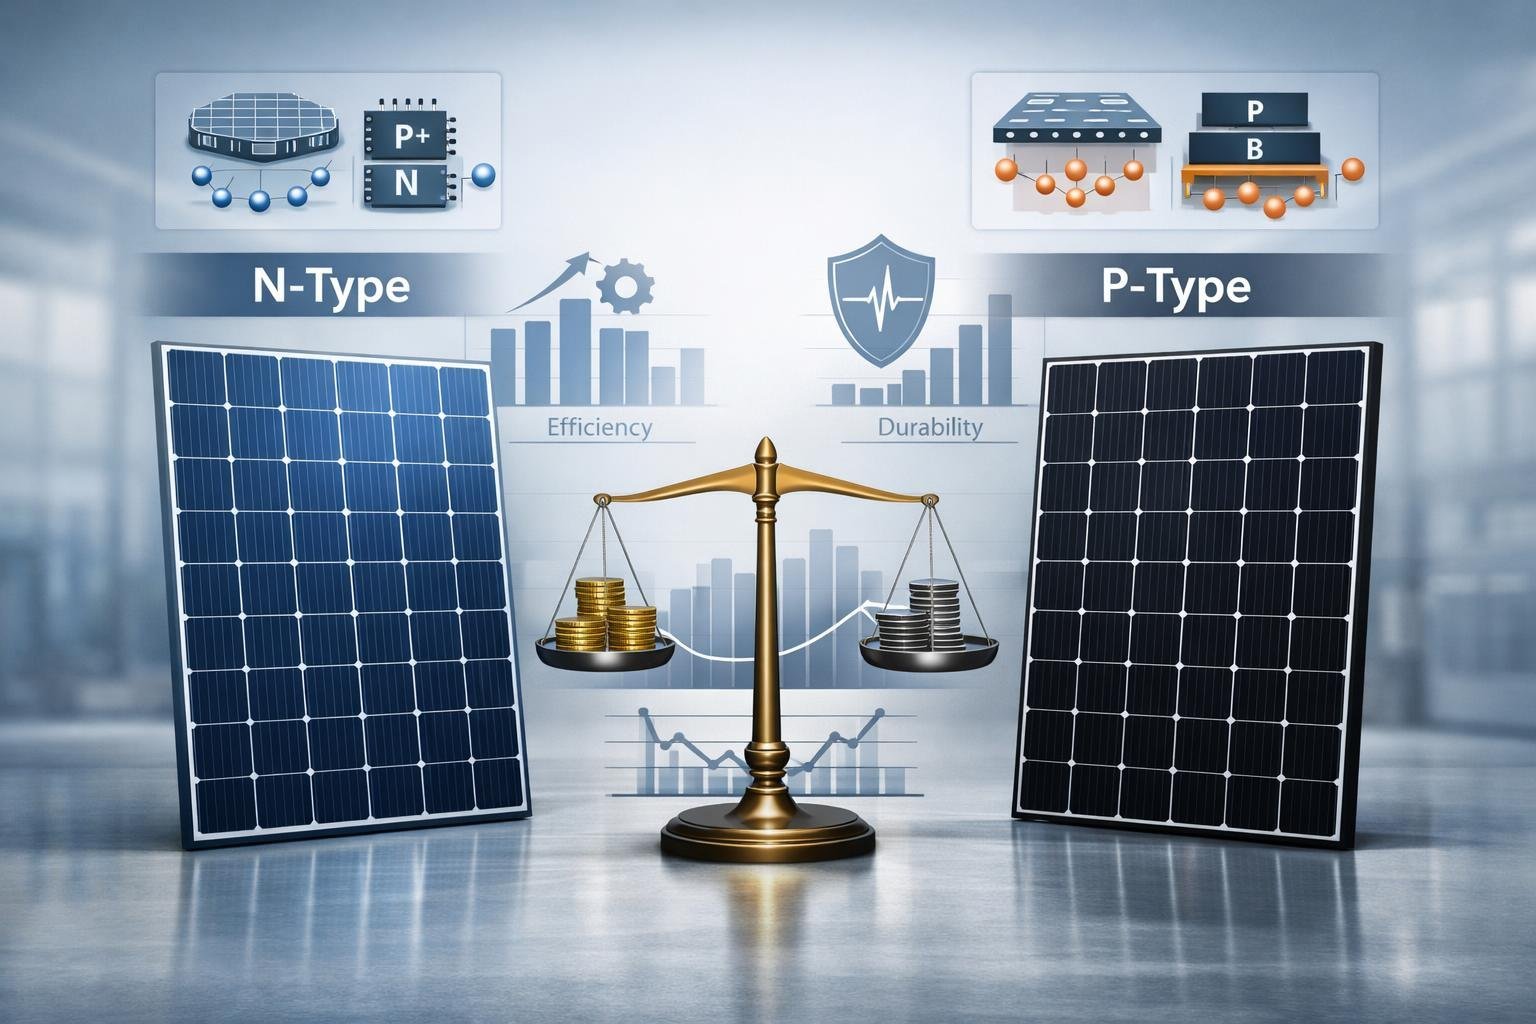
Doping Elements: Boron vs Phosphorus
P-type silicon uses boron doping to make wafers with extra “holes”—positive charge carriers. Boron atoms have fewer electrons than silicon, which creates those positive carriers in the crystal structure.
N-type silicon uses phosphorus doping to add extra electrons and make negatively charged wafers. Phosphorus atoms bring more electrons to the party, so you get more charge carriers.
The doping element you pick changes everything. Boron-doped silicon gets hit by boron-oxygen defects under light and oxygen, losing up to 10% performance. Phosphorus-doped silicon sidesteps this issue because it doesn’t react with oxygen the same way.
Your panel’s bulk region runs a doping density of 10¹⁶cm⁻³, while the emitter layer is way denser at 10¹⁹cm⁻³.
Bulk Region and Emitter Layer Functions
The bulk region is the thicker base layer of your solar cell, around 200μm. In P-type panels, it’s boron-doped silicon. In N-type panels, it’s phosphorus-doped.
The emitter layer sits on top, just 0.5μm thick. P-type solar panels have an N-type emitter, while N-type panels use a P-type emitter. That’s what creates the P-N junction for electricity generation.
When these layers meet, they form an internal electric field. That field splits electrons and holes when sunlight hits the panel. The bulk region’s thickness and doping decide the main charge carriers, while the emitter layer grabs the opposite type.
Comparison of N-Type and P-Type Performance
N-type solar panels bring real gains in efficiency, heat tolerance, and long-term stability compared to p-type panels. The gap between them starts with how phosphorus-doped and boron-doped silicon handle electrons, resist wear, and react to real-world conditions.
Solar Panel Efficiency and Conversion Rates
N-type panels hit 23-26% conversion efficiency. P-type panels manage 20-23%. That 2-4 point edge comes from better electron mobility in phosphorus-doped silicon.
Electrons in n-type cells travel farther before they recombine and vanish as heat. This longer carrier lifetime means more sunlight turns into usable electricity. P-type cells lose more electrons to recombination, since boron-doped silicon starts with fewer free electrons.
If you’re working with limited roof space, higher efficiency means more power per square meter. You’ll need fewer panels to hit your target, which can save you on racking, wiring, and labor.
TOPCon n-type panels usually deliver 23-25% efficiency in real-world models. HJT (Heterojunction) n-type panels go even higher at 24-26%. Standard PERC p-type panels top out at about 22-23%.
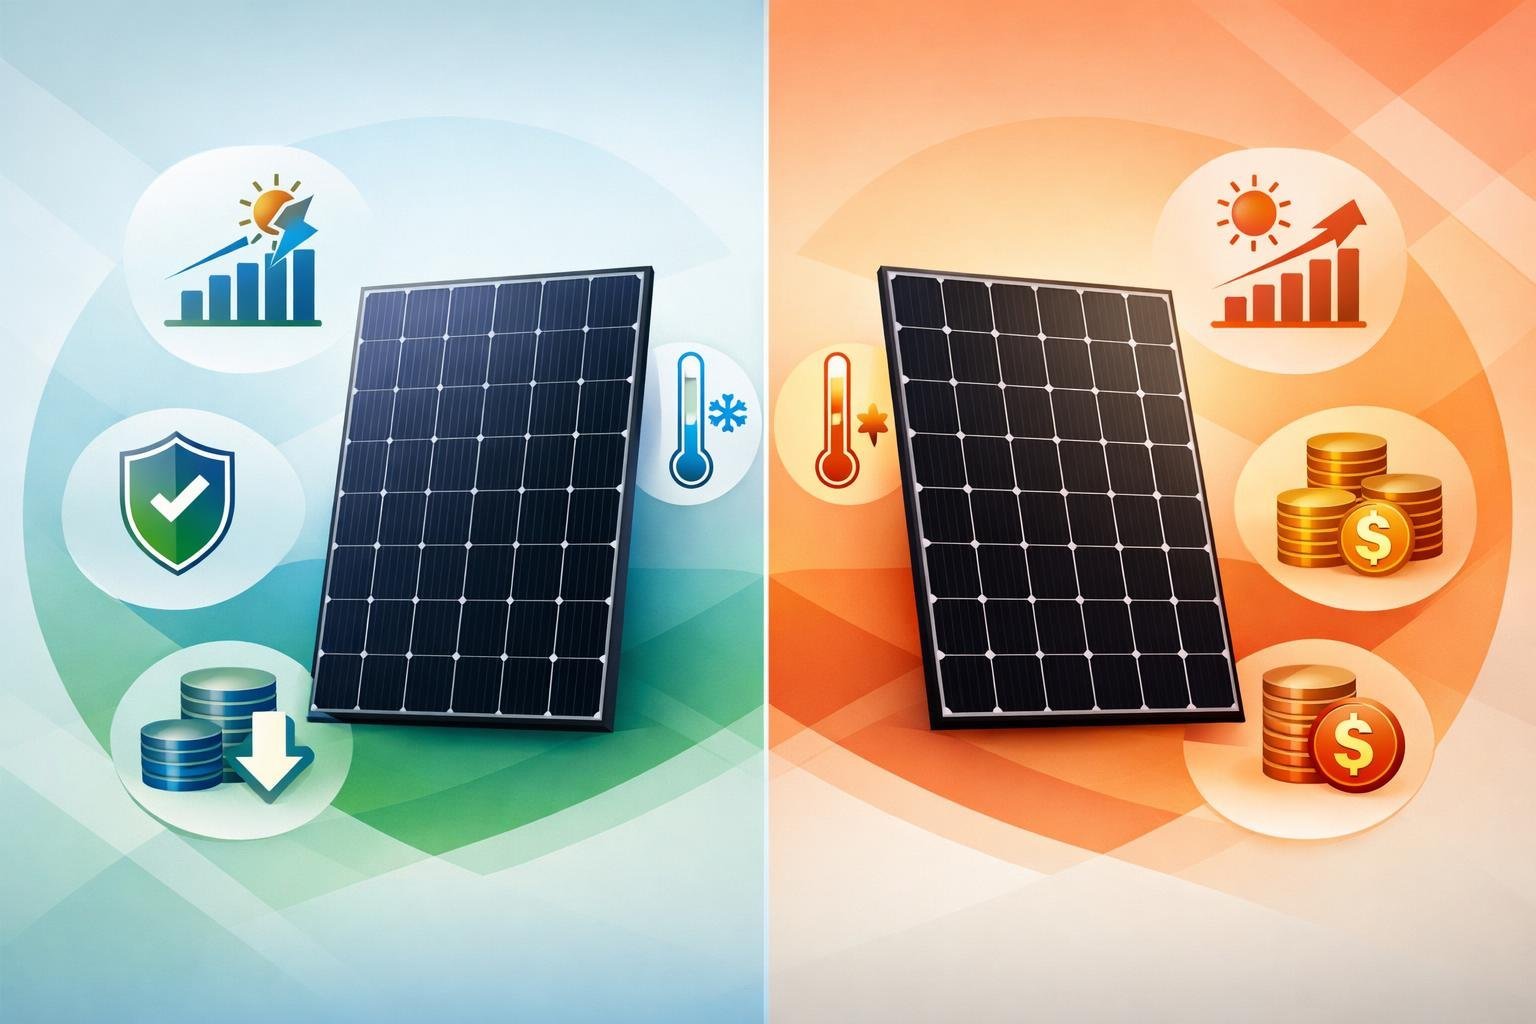
Temperature Coefficient and Thermal Stability
Temperature coefficient tells you how much output drops as panels get hotter than 25°C. N-type panels hold up better in the heat, losing less power per degree of temperature rise.
P-type panels usually have temperature coefficients from -0.35% to -0.40% per °C. N-type TOPCon panels do better at -0.29% to -0.32% per °C. HJT n-type panels are the champs at -0.24% to -0.26% per °C.
On a hot summer day with panels at 60°C, p-type panels lose 12-14% of their rated output. N-type TOPCon panels drop 10-11%. HJT panels lose just 8-9%. Over the year, especially in warm spots, this thermal edge means 3-8% more annual energy yield from n-type installs.
Degradation Mechanisms: LID, PID, and Annual Losses
Light-induced degradation (LID) makes p-type panels lose 1-3% output within hours of their first sunlight. This loss sticks around because boron dopants react with oxygen, creating defects that trap electrons.
N-type panels don’t have boron, so they skip the boron-oxygen defect drama. You get full nameplate capacity from day one, with no early performance drop.
Potential-induced degradation (PID) can hit both, but p-type panels take the bigger hit in high-voltage commercial arrays. N-type cells resist PID better thanks to their charge carrier setup.
P-type panels degrade about 0.8-1.0% per year after that first year. N-type panels degrade only 0.4-0.5% annually. After 25 years, p-type panels make about 75-80% of their original output. N-type panels still crank out 85-90%.
Bifacial and Albedo Performance
Bifacial performance measures how well a panel’s rear side turns reflected light into electricity. N-type cells hit bifaciality factors of 85-95%, so the back works almost as well as the front.
P-type bifacial panels manage only 60-70% bifaciality. The same losses that hurt front-side efficiency also limit the rear.
Bifacial gain depends a lot on albedo—the reflectivity of what’s under your array. White roofs, concrete, or light gravel with albedo values of 0.5 or higher can boost total system output by 15-25% if you mount n-type bifacial panels 1-1.5 meters high.
If you’re over dark surfaces or grass, you won’t see much bifacial gain. Ground-mount commercial and utility setups on reflective surfaces get the biggest benefit from bifacial n-type tech.
Manufacturing Technologies and Cost Analysis
By 2026, three cell architectures—TOPCon, HJT, and PERC—dominate the market. They each bring their own quirks in manufacturing, capital needs, and long-term costs.
TOPCon panels now hit price parity with PERC and offer better performance. HJT, on the other hand, costs a bit more but boasts top-tier efficiency and temperature ratings.
Overview of TOPCon, HJT, and PERC Technologies
PERC (Passivated Emitter and Rear Cell) uses P-type boron-doped silicon with a passivation layer on the back. This layer bounces unused light back into the cell, squeezing out more power.
PERC took over from 2015 to 2023, with efficiency limits of 22-23%. Most factories already run the screen-printing processes needed for PERC, so it’s familiar territory for manufacturers.
TOPCon (Tunnel Oxide Passivated Contact) builds on N-type wafers by adding an ultra-thin oxide layer and phosphorus-doped polysilicon film. This tunnel contact cuts electron recombination and bumps efficiency.
Manufacturers can upgrade PERC lines to TOPCon for $30-40 million per gigawatt. No need to start from scratch with new buildings or equipment.
HJT (Heterojunction Technology) uses thin layers of amorphous silicon on crystalline N-type wafers, all at low temperatures (below 200°C). You’ll need brand new gear to make HJT cells, but you get the highest efficiency—24-26%—and the best temperature coefficients.
The process itself is simple and uses fewer steps than TOPCon or PERC. Still, those specialized machines don’t come cheap.
Production and Manufacturing Costs
Module prices have gotten squeezed in 2026. TOPCon panels now run $0.25-$0.35 per watt, almost matching PERC at $0.18-$0.25 per watt.
HJT still sits at a 10-20% premium, but that difference is shrinking as factories scale up.
The real cost differences come from capital expenses. You can convert a PERC line to TOPCon for about $30-40 million per GW per year.
HJT, though, needs a brand new setup—think $80-120 million per GW for all that low-temperature deposition equipment.
When you calculate total cost of ownership, remember to factor in efficiency and warranty length. A TOPCon panel at 25% efficiency produces more energy per square meter than a 22% PERC panel, so you’ll need less racking, wiring, and labor.
Over 30 years, that extra energy from N-type panels usually makes up for the higher upfront cost. It’s not always obvious at first glance, but it adds up.
Power Degradation Warranties and Lifespan
N-type panels come with much better degradation warranties than P-type PERC. TOPCon panels typically guarantee 87-88% of their original output after 30 years.
HJT warranties can even hit 88-90% after 30-35 years. PERC panels, by contrast, usually guarantee 80-84% after 25-30 years.
Those warranty numbers aren’t just marketing. Annual degradation rates are around 0.4-0.5% for N-type cells, while P-type sits at 0.8-1.0% per year.
Over decades, that difference compounds—fast.
Degradation Comparison:
| Technology | Annual Degradation | 25-Year Output | 30-Year Output | Warranty Period |
|---|---|---|---|---|
| PERC | 0.8-1.0% | 75-80% | 70-75% | 25-30 years |
| TOPCon | 0.4-0.5% | 87-90% | 85-88% | 30 years |
| HJT | 0.4-0.5% | 87-90% | 85-88% | 30-35 years |
N-type panels don’t suffer from light-induced degradation at all. They deliver their full nameplate output from the very first day.
PERC panels, on the other hand, lose 1-3% in the first hours of sunlight. That’s a sneaky hit to lifetime energy yield and ROI, especially for B2B projects running 25-35 years.
Applications and Use Cases for B2B

N-type panels really shine in big deployments where every bit of efficiency, degradation rate, and temperature performance matters for the bottom line.
Commercial rooftops with limited space get the most out of higher wattage per square meter. Utility-scale farms, meanwhile, benefit from lower annual degradation over decades.
Commercial and Utility-Scale Solar Installations
Commercial rooftops face space limits that make N-type’s 23–26% efficiency a game-changer. If you’ve got a warehouse with 50,000 square feet, you’ll squeeze out 15–20% more power using N-type TOPCon or HJT instead of P-type PERC.
That extra output can save you from needing more construction phases or outside power deals. Ground-mount utility projects care most about lifetime yield and degradation resistance.
N-type’s 0.4–0.5% annual degradation, compared to P-type’s 0.8–1.0%, means a 100 MW solar farm will crank out about 1.2–1.8 GWh more electricity per year by year 25.
At $0.10/kWh, that’s an extra $120,000–$180,000 per year. Not pocket change.
Bifacial N-type panels set up on white gravel or concrete can snag 15–25% energy gains from rear-side generation.
Developers in places like Nevada and Texas are already specifying bifacial TOPCon arrays with 1.2-meter mounting heights to catch more reflected light and boost output, all without using more land.
Industry-Specific Considerations for Panel Selection
Data centers and cold storage facilities want maximum power density per square foot. HJT panels, at 24–26% efficiency, let you install fewer panels and inverters to hit your megawatt targets.
Their temperature coefficient—around −0.24% to −0.26%/°C—helps keep power output steady during hot afternoons, when cooling loads spike.
Agricultural solar projects need panels that can handle tough conditions. Greenhouses and agrivoltaic setups mean high humidity, temperature swings, and lots of reflected light.
N-type panels shrug off light-induced degradation and don’t mind moisture as much, so they hold up better than P-type in these spots.
Manufacturing facilities with 15–20 year equipment cycles can actually get more from N-type’s 30–35 year warranties. Your solar array might outlast two rounds of factory upgrades, all while keeping 85–90% of its original output intact.
That’s a real win for long-term sustainability and Scope 2 emissions goals.
Long-Term Financial Impact and Levelized Cost of Energy
Levelized cost of energy (LCOE) calculations tend to favor N-type, even though you pay 10–20% more upfront for the modules.
For example, a 5 MW commercial system using N-type TOPCon at $0.30/W (instead of P-type PERC at $0.22/W) adds $400,000 to the initial bill. But over 30 years, it’ll generate $1.2–1.6 million more in lifetime energy.
That LCOE advantage grows in hot climates. A Florida factory running at 55–60°C cell temps sees HJT panels produce 5–8% more annual energy than P-type.
Over 25 years, this narrows the upfront cost gap and lowers LCOE by 12–18%.
Financial models should include lower O&M costs, too. N-type panels degrade slower, so you’ll replace fewer panels, spend less on monitoring, and keep more energy flowing.
That can shave $0.002–$0.004/kWh off operating expenses compared to P-type arrays.
| Panel Type | Initial Cost ($/W) | Year 25 Output | 25-Year LCOE | Annual kWh (5 MW) |
|---|---|---|---|---|
| P-Type PERC | $0.22 | 75–80% | $0.042/kWh | 6,500,000 |
| N-Type TOPCon | $0.30 | 85–90% | $0.038/kWh | 7,200,000 |
| N-Type HJT | $0.35 | 85–90% | $0.036/kWh | 7,400,000 |
Industry Trends and Market Leaders in 2026
N-type TOPCon looks set to overtake P-type in global shipments by 2026. Major manufacturers are ramping up production fast, and the price gap between TOPCon and PERC keeps shrinking.
Global Market Shift and Technology Adoption
The solar industry’s in the middle of a big shift from P-type to N-type cells. N-type TOPCon is on track to pass P-type panels in shipments this year, mostly thanks to better performance and falling costs.
Production capacity for N-type cells has exploded over the last year. That’s helped drive down costs and make N-type more competitive.
But there’s a twist—oversupply in P-type cells might actually widen the price gap in the short run. Some analysts think P-type PERC could fade out in two or three years as the industry chases more advanced cell designs.
N-type TOPCon works well with bifacial and floating solar systems, too. That flexibility opens up more commercial and utility-scale projects.
Leading Manufacturers: LONGi, Jinko Solar, Trina Solar, JA Solar
LONGi, Jinko Solar, Trina Solar, and JA Solar are leading the N-type TOPCon charge in 2026. They’ve poured money into new lines and are pushing costs down through sheer scale.
Each company is moving from P-type PERC to N-type cells, and their production volumes are making TOPCon the new standard.
These brands now offer N-type modules for both residential and commercial markets. If you’re comparing suppliers, look at warranty terms, efficiency, and bifacial performance.
Most N-type panels from these manufacturers come with 30-year performance warranties, while older P-type products usually stick to 25 years.
Frequently Asked Questions
N-type solar panels deliver real advantages in efficiency, degradation resistance, and temperature performance. P-type panels still compete on price in some segments, but these differences make a big impact on total cost of ownership and energy yield for commercial projects.
What are the distinct performance characteristics between N-type and P-type solar panels?
N-type panels deliver 23-26% conversion efficiency. P-type panels hit 20-23%.
This efficiency gap means you get more power from the same roof or ground space. That’s a big deal if you’ve got limited area.
N-type technology doesn’t suffer from light-induced degradation. P-type panels lose 1-3% of their output in the first hours of operation because of boron-oxygen defects.
Temperature performance? There’s a real difference. N-type panels have temperature coefficients of -0.24% to -0.32% per degree Celsius, while P-type panels drop off at -0.35% to -0.40% per degree.
If your panels reach 60°C on a hot day, P-type modules lose 12-14% of their rated output. N-type modules lose only 8-11%.
N-type panels achieve bifaciality factors of 85-95%. P-type panels usually reach just 60-70%.
If you install bifacial panels over something reflective, N-type technology grabs a lot more energy from the rear side. That’s a nice bonus for certain sites.
How do the costs of N-type solar panels compare to P-type panels for B2B customers?
N-type panels cost $0.25-$0.35 per watt in 2026. P-type panels come in at $0.18-$0.25 per watt.
The price gap has shrunk a lot compared to just a few years ago. N-type’s higher efficiency means you need fewer panels, so you spend less on racking, wiring, inverters, and labor.
The levelized cost of energy matters most. N-type panels produce 5-8% more annual energy in warm climates and degrade at 0.4-0.5% per year instead of 0.8-1.0%.
Over 25-30 years, these factors often balance out the higher upfront cost. For most commercial projects, TOPCon N-type offers the best value.
HJT commands a 10-20% premium but gives better performance in hot climates or where space is tight. It’s not always worth the extra, but sometimes it really is.
What advancements have been made in N-type solar panel technology as of 2026?
N-type technology now makes up over 60% of global solar cell production capacity. TOPCon leads the market with about 60% of N-type installations.
Manufacturing costs have dropped a lot. You can upgrade TOPCon production lines from existing PERC equipment for $30-40 million per gigawatt.
This shift has sped up the industry transition. Efficiency records keep climbing, too.
Production-grade TOPCon modules regularly hit 23-25%. HJT panels reach 24-26%.
Lab efficiencies already break 33% for next-generation designs. Warranty terms have gotten better as well.
Most N-type manufacturers now offer 30-year performance warranties. Some HJT producers go up to 35 years.
What is the expected lifespan and degradation rate of N-type versus P-type solar panels?
N-type panels degrade at 0.4-0.5% per year after the first year. After 25 years, you keep about 85-90% of the original output.
P-type panels degrade at 0.8-1.0% per year. After 25 years, you’re left with roughly 75-80% of nameplate capacity.
If you install a 1 MW P-type system, you’ll get around 800 kW in year 25. The same N-type system gives you 850-900 kW.
P-type manufacturers usually guarantee 25-30 years. N-type warranties stretch from 30 to 35 years.
The 10-15% output difference in year 25 has a real impact on revenue for power purchase agreements or energy cost savings. Your financial models shouldn’t ignore that.
Can you outline the efficiency trends in N-type and P-type solar panels over the last five years?
P-type PERC technology hit its efficiency ceiling at 22-23% by 2021. Since then, gains have been tiny—usually less than 0.2 percentage points per year.
N-type technology has driven all the big efficiency jumps since 2022. TOPCon improved from 22-23% in 2022 to 23-25% in 2026.
HJT advanced from 23-24% to 24-26% over the same period. Market share shifted fast, too.
P-type held over 90% of global capacity in 2021, but by early 2026, N-type technologies control more than 60% of production capacity. The trend’s clear—N-type is taking over.
Industry analysts think dedicated P-type PERC manufacturing will mostly disappear by 2027. Most big manufacturers have already switched or set conversion timelines.
What environmental factors should be considered when choosing between N-type and P-type solar panels for large-scale installations?
Temperature really stands out as the most critical variable when picking solar technology. If your installation site deals with long stretches of high heat, you’ll see N-type panels pull ahead with noticeably higher annual yields.
HJT panels, for example, seem to thrive in hot climates—think Texas, Florida, Arizona, and the whole Southwest. Their -0.24% to -0.26% temperature coefficient keeps heat-related losses low. That means you could see 5-8% more annual energy compared to P-type panels in these areas.
Snow and reflective surfaces can actually work in your favor if you go with bifacial N-type panels. White roofs, concrete pads, sand, or even a layer of snow can help boost rear-side energy capture.
If you mount these panels at the right height—usually around 1 to 1.5 meters—you could snag 15-25% bifacial gains. Not bad, right?
Humidity and salty air near the coast call for a closer look at your module’s build. Both N-type and P-type panels need solid encapsulation and frame sealing, so check the manufacturer’s specs for salt mist and damp heat certifications.
Shading patterns can really mess with your energy output. N-type panels tend to handle partial shade better, thanks to their superior minority carrier lifetime.
If you can’t avoid shade from trees, buildings, or awkward terrain, N-type technology helps you hang onto more energy. That’s a relief for tricky sites.
Wind and snow load ratings? They always matter, no matter which cell type you pick. Make sure your panels meet local building codes for wind speeds and snow loads.


